Transverse-field ![]() SR spectra with approximately
SR spectra with approximately
![]() muon decay events were taken under conditions of field cooling in applied
magnetic fields of 0.5T and 1.5T.
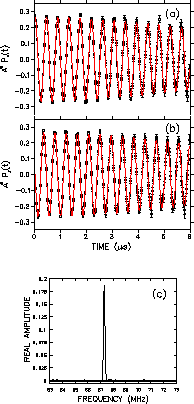
Figure 4.2(a) and Fig. 4.2(b) show the real and
imaginary asymmetry spectra
pertaining to the
muon decay events were taken under conditions of field cooling in applied
magnetic fields of 0.5T and 1.5T.
Figure 4.2(a) and Fig. 4.2(b) show the real and
imaginary asymmetry spectra
pertaining to the
![]() sample resting in
an applied field of 0.5T and at a
temperature well above Tc ( i.e.
sample resting in
an applied field of 0.5T and at a
temperature well above Tc ( i.e.
![]() K).
For convenience the signals are displayed in a reference frame rotating
at a frequency 2.3MHz below the Larmor precession frequency of a
free muon. The average frequency of oscillation in Fig. 4.2(a) and
Fig. 4.2(b)
is determined by
the applied magnetic field of 0.5T. Consequently, the
corresponding frequency distribution [see Fig. 4.2(c)]
exhibits a single peak at 67.3MHz
related to the applied field through Eq. (3.14).
Visual inspection of
Fig. 4.2(a) and Fig. 4.2(b)
suggests that the real and imaginary asymmetry
spectra differ in phase by
K).
For convenience the signals are displayed in a reference frame rotating
at a frequency 2.3MHz below the Larmor precession frequency of a
free muon. The average frequency of oscillation in Fig. 4.2(a) and
Fig. 4.2(b)
is determined by
the applied magnetic field of 0.5T. Consequently, the
corresponding frequency distribution [see Fig. 4.2(c)]
exhibits a single peak at 67.3MHz
related to the applied field through Eq. (3.14).
Visual inspection of
Fig. 4.2(a) and Fig. 4.2(b)
suggests that the real and imaginary asymmetry
spectra differ in phase by
![]() ,
consistent with the discussion
in the previous chapter. The solid curve passing through the data points is a
fit to the data using a polarization function in the form of
Eq. (3.21)
with a relaxation function resembling Eq. (3.33), so that
,
consistent with the discussion
in the previous chapter. The solid curve passing through the data points is a
fit to the data using a polarization function in the form of
Eq. (3.21)
with a relaxation function resembling Eq. (3.33), so that
 |
As one cools the sample below Tc, the relaxation
rate of the muon precession
signal increases due to the presence of the vortex lattice.
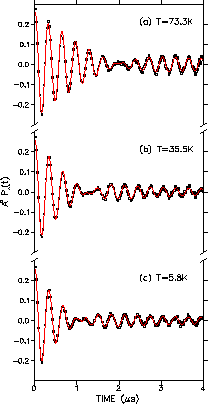
The asymmetry spectra pertaining to a pair of counters for the
![]() crystals in an applied field of 0.5T is shown for three different
temperatures below Tcin Fig. 4.3.
The signals are shown in a rotating reference
frame 3.3MHz below the Larmor precession frequency of a free muon.
As the muons stop randomly on the length
scale of the flux lattice, the muon spin precession signal provides a
random sampling of the internal field distribution in the vortex state.
The ensuing asymmetry spectrum is a superposition of a signal
resembling Fig. 3.12 originating
from muons which stop in the sample and an
inseparable background signal resembling
Fig. 4.2(c),
due to muons which miss the sample, do not trigger
the veto counter and whose positron also does not trigger the veto counter.
The origin of the residual background signal is still uncertain, but may
be due to those muons which scatter at wide angles after passing
through the muon counter and are thus not vetoed by the V counter.
Fig. 3.12 was obtained
by choosing a rotating reference frame frequency equal to the
background frequency, determined by fitting the data. Unfortunately, the
broadening of the
background signal is not necessarily identical to the field distribution
above Tc and thus cannot be fixed in the fits below Tc.
crystals in an applied field of 0.5T is shown for three different
temperatures below Tcin Fig. 4.3.
The signals are shown in a rotating reference
frame 3.3MHz below the Larmor precession frequency of a free muon.
As the muons stop randomly on the length
scale of the flux lattice, the muon spin precession signal provides a
random sampling of the internal field distribution in the vortex state.
The ensuing asymmetry spectrum is a superposition of a signal
resembling Fig. 3.12 originating
from muons which stop in the sample and an
inseparable background signal resembling
Fig. 4.2(c),
due to muons which miss the sample, do not trigger
the veto counter and whose positron also does not trigger the veto counter.
The origin of the residual background signal is still uncertain, but may
be due to those muons which scatter at wide angles after passing
through the muon counter and are thus not vetoed by the V counter.
Fig. 3.12 was obtained
by choosing a rotating reference frame frequency equal to the
background frequency, determined by fitting the data. Unfortunately, the
broadening of the
background signal is not necessarily identical to the field distribution
above Tc and thus cannot be fixed in the fits below Tc.
 |
 |
The beat occurring in all three spectra of Fig. 4.3 is due to the
difference in the average precession frequency of a muon in the internal
field of the vortex lattice and the precession frequency of the muon
in the background field. The solid curves in Fig. 4.3
are fits to the
theoretical polarization function of Eq. (3.39).
An additional polarization
function in the form of Eq. (4.1)
was added to model the background signal
pertaining to the muons which missed the sample, so that the measured
asymmetry is of the form:
| A(t) = Asam (t) + Abkg (t) | (2) |
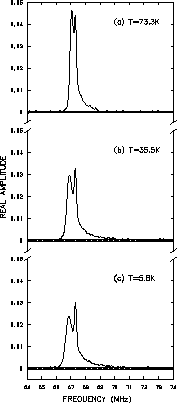
As the temperature is lowered, the vortices
become better separated and the muon spin relaxes faster due to
the presence of a broader distribution of internal magnetic fields.
This is better displayed in Fig. 4.4 which shows the corresponding
real Fourier transforms of Fig. 4.3.
Recall from Eq. (3.6) that the width
of the field distribution is proportional to
![]() .
Thus
it is clear from Fig. 4.4
that
.
Thus
it is clear from Fig. 4.4
that
![]() decreases with decreasing
temperature. The sharp spike on the right side of each frequency
distribution in Fig. 4.4 is attributed to the residual background
signal. It has been determined to account for approximately
decreases with decreasing
temperature. The sharp spike on the right side of each frequency
distribution in Fig. 4.4 is attributed to the residual background
signal. It has been determined to account for approximately ![]() of the total signal amplitude at 0.5T and
of the total signal amplitude at 0.5T and ![]() at 1.5T.
at 1.5T.
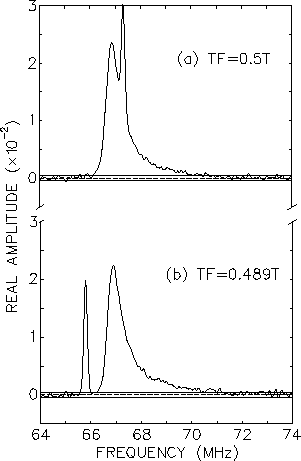
Figure 4.5 shows the frequency
distribution resulting from field cooling
the sample in the 0.5T field [Fig. 4.5(a)] and then lowering the
applied field by 11.3mT [Fig. 4.5(b)].
As shown the background signal
shifts down by 1.5MHz and positions itself at the Larmor
frequency corresponding
to the new applied field. The signal originating from muons which stop
in the sample does not appear to change under this small shift in field.
This clearly demonstrates that at low temperatures
the vortex lattice is strongly
pinned. Furthermore, the absence of any background peak in the
unshifted signal implies that the sample is free of any appreciable
non-superconducting inclusions. The shifting of the background peak
away from the sample signal has since been duplicated for higher temperatures
and at other applied fields. Field shifts in excess of ![]() G were not
attempted for fear that the crystals would shatter as a result of the
strain exerted by the pinned vortex lattice.
G were not
attempted for fear that the crystals would shatter as a result of the
strain exerted by the pinned vortex lattice.
 |
The asymmetric frequency distribution shown isolated in
Fig. 4.5(b) has
the basic features one would anticipate for a triangular vortex lattice,
but with the van Hove singularities
shown in Fig. 3.1(b) smeared out. Structural defects
in the vortex lattice, variations in the average field due to
demagnetization effects
and ![]() -
-![]() anisotropy are all possible
reasons for a lack of sharper features.
anisotropy are all possible
reasons for a lack of sharper features.