Muon spin relaxation experiments were carried out on samples
of solid, pure nitrogen using conventional time-differential
transverse field (TF) techniques.
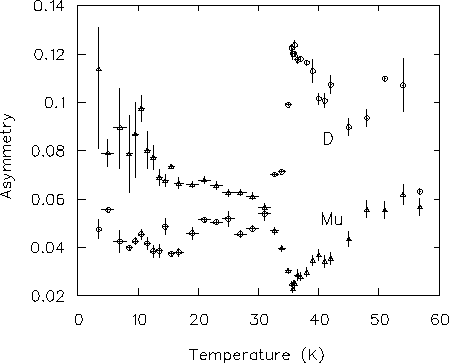
In the low temperature ![]() phase a large muonium signal
and a smaller diamagnetic muon signal together account
for virtually all the muon polarization.
In
phase a large muonium signal
and a smaller diamagnetic muon signal together account
for virtually all the muon polarization.
In ![]() -N2 and
-N2 and ![]() -N2 some of the diamagnetic fraction
appears as an additional fast-relaxing signal (with initial
asymmetry
-N2 some of the diamagnetic fraction
appears as an additional fast-relaxing signal (with initial
asymmetry ![]() and relaxation rate
and relaxation rate ![]() )
and all the asymmetries are temperature dependent.
The total asymmetry therefore has the form
)
and all the asymmetries are temperature dependent.
The total asymmetry therefore has the form
The slowly-relaxing diamagnetic asymmetry ![]() and muonium asymmetry
and muonium asymmetry ![]() obtained are
shown in Fig. 4.11.
The most striking feature in the temperature dependence
of these is the obvious anticorrelation between them at
temperatures near T
obtained are
shown in Fig. 4.11.
The most striking feature in the temperature dependence
of these is the obvious anticorrelation between them at
temperatures near T![]() ,suggesting the presence of competing processes in which the
stopping muon either captures an electron to form muonium,
or eventually becomes incorporated into a molecular ion.
Since only half of the muonium asymmetry is experimentally
observable, (the other half oscillating too fast
to be resolved - see Appendix A)
loss of some of the diamagnetic species to
muonium formation results in an increase in the muonium
asymmetry half as large. The total
,suggesting the presence of competing processes in which the
stopping muon either captures an electron to form muonium,
or eventually becomes incorporated into a molecular ion.
Since only half of the muonium asymmetry is experimentally
observable, (the other half oscillating too fast
to be resolved - see Appendix A)
loss of some of the diamagnetic species to
muonium formation results in an increase in the muonium
asymmetry half as large. The total ![]() is nearly temperature independent.
Since the free electron mobility in
is nearly temperature independent.
Since the free electron mobility in ![]() -N2 increases with
temperature below T
-N2 increases with
temperature below T![]() like the muonium fraction, this strongly
suggests that transport of electrons through the
lattice is involved in muonium formation in solid nitrogen.
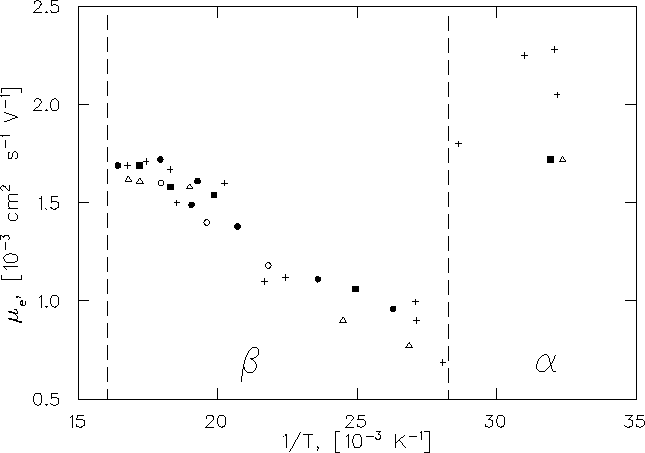
The electron mobility measured in solid nitrogen by Loveland et al.
is shown in Fig. 4.12.
From 63 K down to 53 K the mobility
like the muonium fraction, this strongly
suggests that transport of electrons through the
lattice is involved in muonium formation in solid nitrogen.
The electron mobility measured in solid nitrogen by Loveland et al.
is shown in Fig. 4.12.
From 63 K down to 53 K the mobility ![]() is constant at about
1.7
is constant at about
1.7![]() 10-3 cm2s-1V-1; it then decreases
gradually to half this value
at
T
10-3 cm2s-1V-1; it then decreases
gradually to half this value
at
T![]() [19].
The available mobility data below T
[19].
The available mobility data below T![]() doesn't reveal
the trend in
doesn't reveal
the trend in ![]() -N2 but it does indicate that the mobility
is sharply increased to about
-N2 but it does indicate that the mobility
is sharply increased to about
![]() in the
in the ![]() phase.
Over this range in T the muonium asymmetry changes by about
the same fraction as the electron mobility, at least in the
phase.
Over this range in T the muonium asymmetry changes by about
the same fraction as the electron mobility, at least in the
![]() phase.
phase.
 |