Superconducting Lineshapes in
Transverse Field
FFT exercise for TSI 2011 Data Analysis workshops
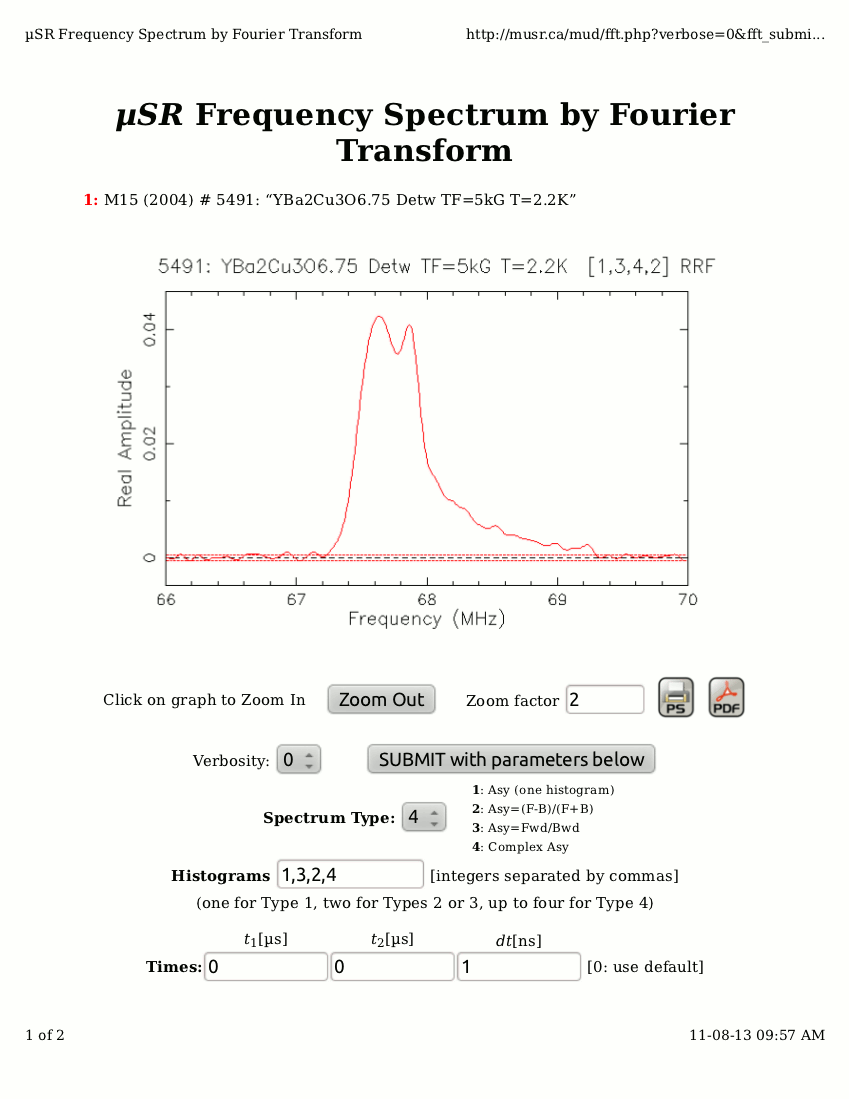
One of the more challenging applications of the Fast Fourier Transform
in µSR is the display of frequency distributions
(a.k.a. "lineshapes") from muons in the vortex lattice of
a type II superconductor in the mixed state, where flux penetrates
the sample in columnar vortices bearing one flux quantum each;
these vortices repel each other and, in optimal circumstances,
form a regular 2-dimensional lattice in the planes normal to the field.
The most common lattice is triangular, but square or rectangular
lattices form in other cases. Each lattice type produces a slightly
different lineshape due to van Hove singularities at the saddle points,
minima and cusps of the field distribution.
The resultant lineshapes usually exhibit three characteristic features:
the low-field cutoff at the minimum field (muons that land equidistant
from all neighboring vortices), a sharp cusp at the saddle-point field
(the most plentiful locations in the lattice)
and a high-field "tail" from muons landing near the vortex centers,
usually with a high-field cutoff due to the finite size of the vortex cores.
All these features can be interpreted in terms of the crucial
electromagnetic properties of the material: the magnetic penetration depth
λ and the coherence length ξ.
But the lineshape must first be displayed accurately.
A good first attempt at producing the desired FFTs
for TRIUMF µSR runs
can be achieved on any Web browser using the MUD Runs Database at
http://musr.ca/mud/,
but a publication-quality 3D-like plot is best produced using the
fft3d program on bnqrexp.triumf.ca
(unfortunately this version is not available on the Hennings workstations).
This program is based on the same msrfft program
used by the Web utility, but interfaced to the TRIUMF GPLOT
graphics library, which can make editable plots in EDGR format.
The Experiments
You have a choice of superconductors measured at TRIUMF
in various transverse fields (TF) at various temperatures:
niobium (Nb) at 0.5 T,
vanadium (V) at 0.16 T
or YBa2Cu3O6.75
("YBCO") at 0.5 T.
The Exercise
For each, a command script is provided to generate the lineshapes
using fft3d on bnqrexp.triumf.ca;
rather than try to construct the optimal conditions "from scratch",
we have provided what we think is an optimal script
and invite you to play with it to see what happens
if you change things (like using a different time range).
Have fun!
Appendix
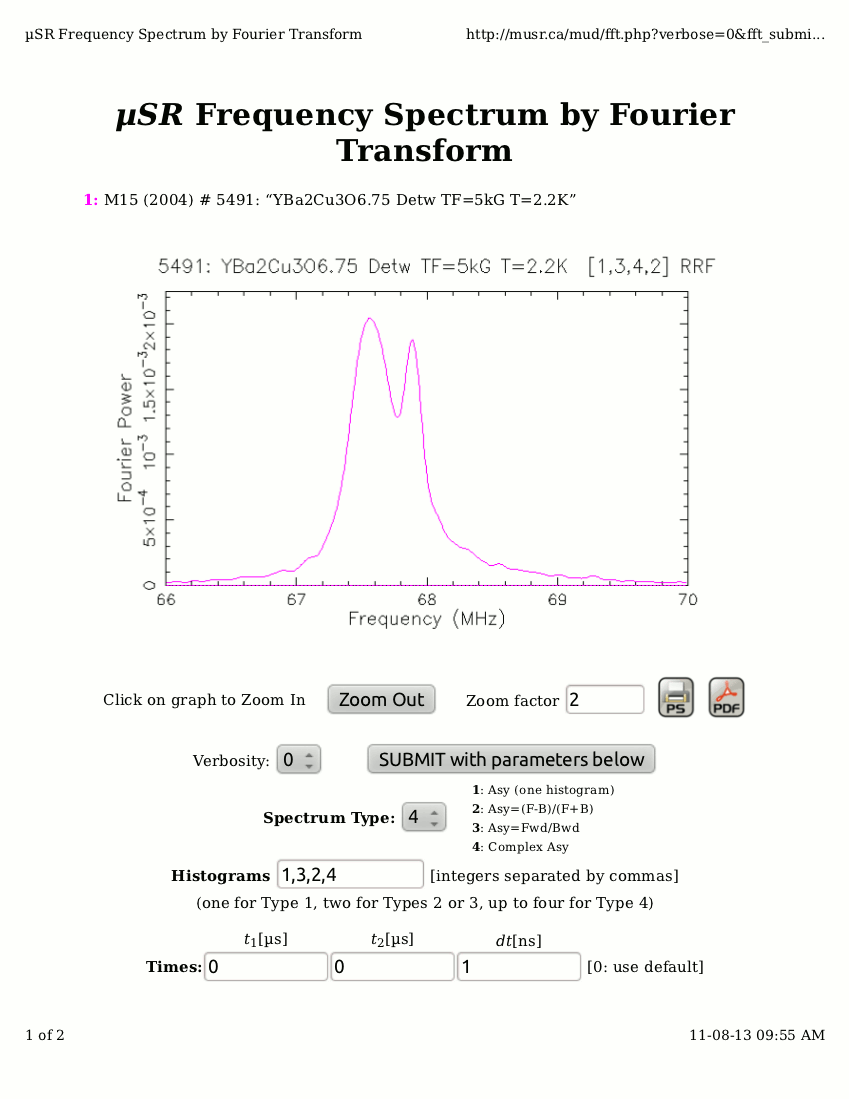
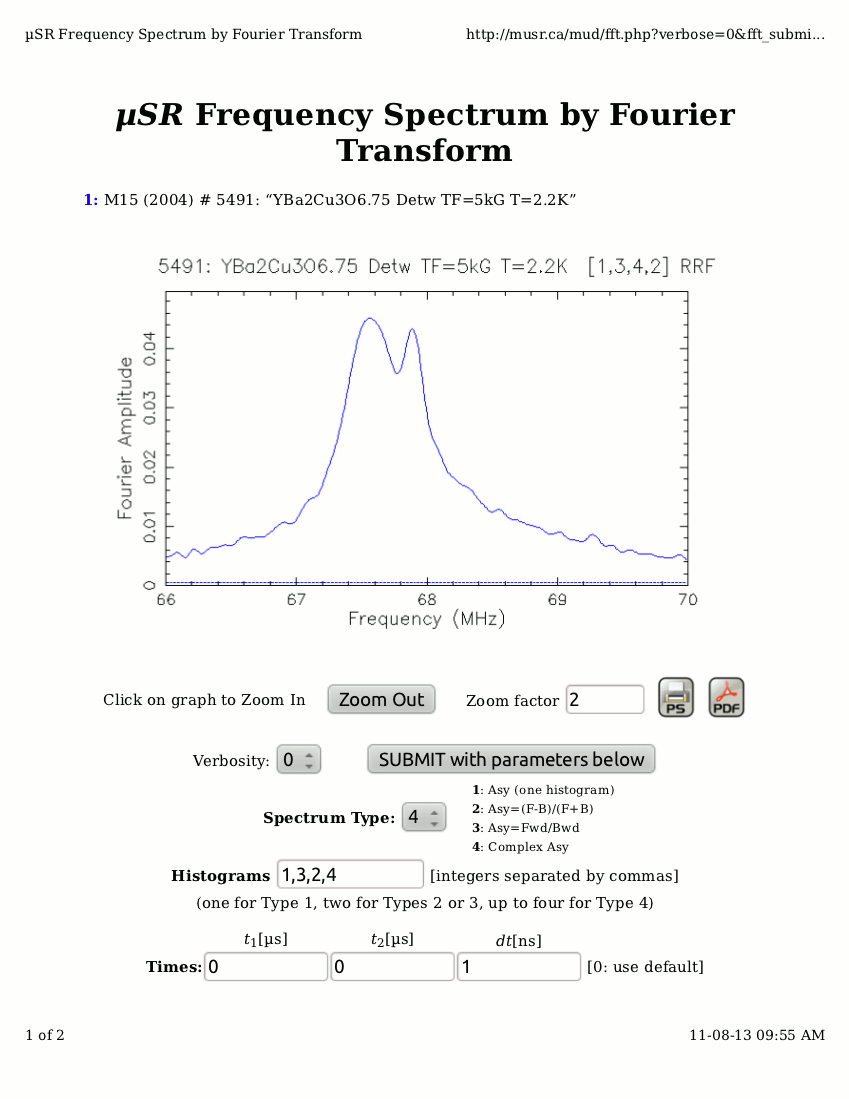
Just in case you still think the Fourier Power spectrum is "good enough",
have a look at the following plots of the same data as Power, Amplitude and
Real Amplitude spectra, all other things being equal:
Jess H. Brewer
Last modified: Sun Aug 14 22:56:47 PDT 2011